Microeconomics → International Trade → Tariffs | Part 2 of 4
Part 2 of our four-part tariff learning pathway. Discover how world prices influence domestic production, consumption and imports before introducing a tariff.
In the previous article, Who Actually Pays a Tariff? Where the Money Goes and Who Bears the Cost, we followed Joanne, a supermarket buyer, to see what happens when a tariff is imposed on imported tomatoes.
But before we can understand a tariff diagram, we need to understand the market before the tariff is added.
Why are tomatoes being imported in the first place? What does the “world price” on the diagram actually mean? And how do imports appear on the graph?
We can answer those questions by building the model one step at a time.
Start with a market without imports
Suppose supermarkets cannot currently buy tomatoes from overseas, perhaps because a trade restriction is in place.
British consumers still want tomatoes, and British producers still supply them. The price is determined by domestic demand and domestic supply.
At the equilibrium price, the quantity consumers want to buy is equal to the quantity British producers want to sell.
We will call this the no-trade price.
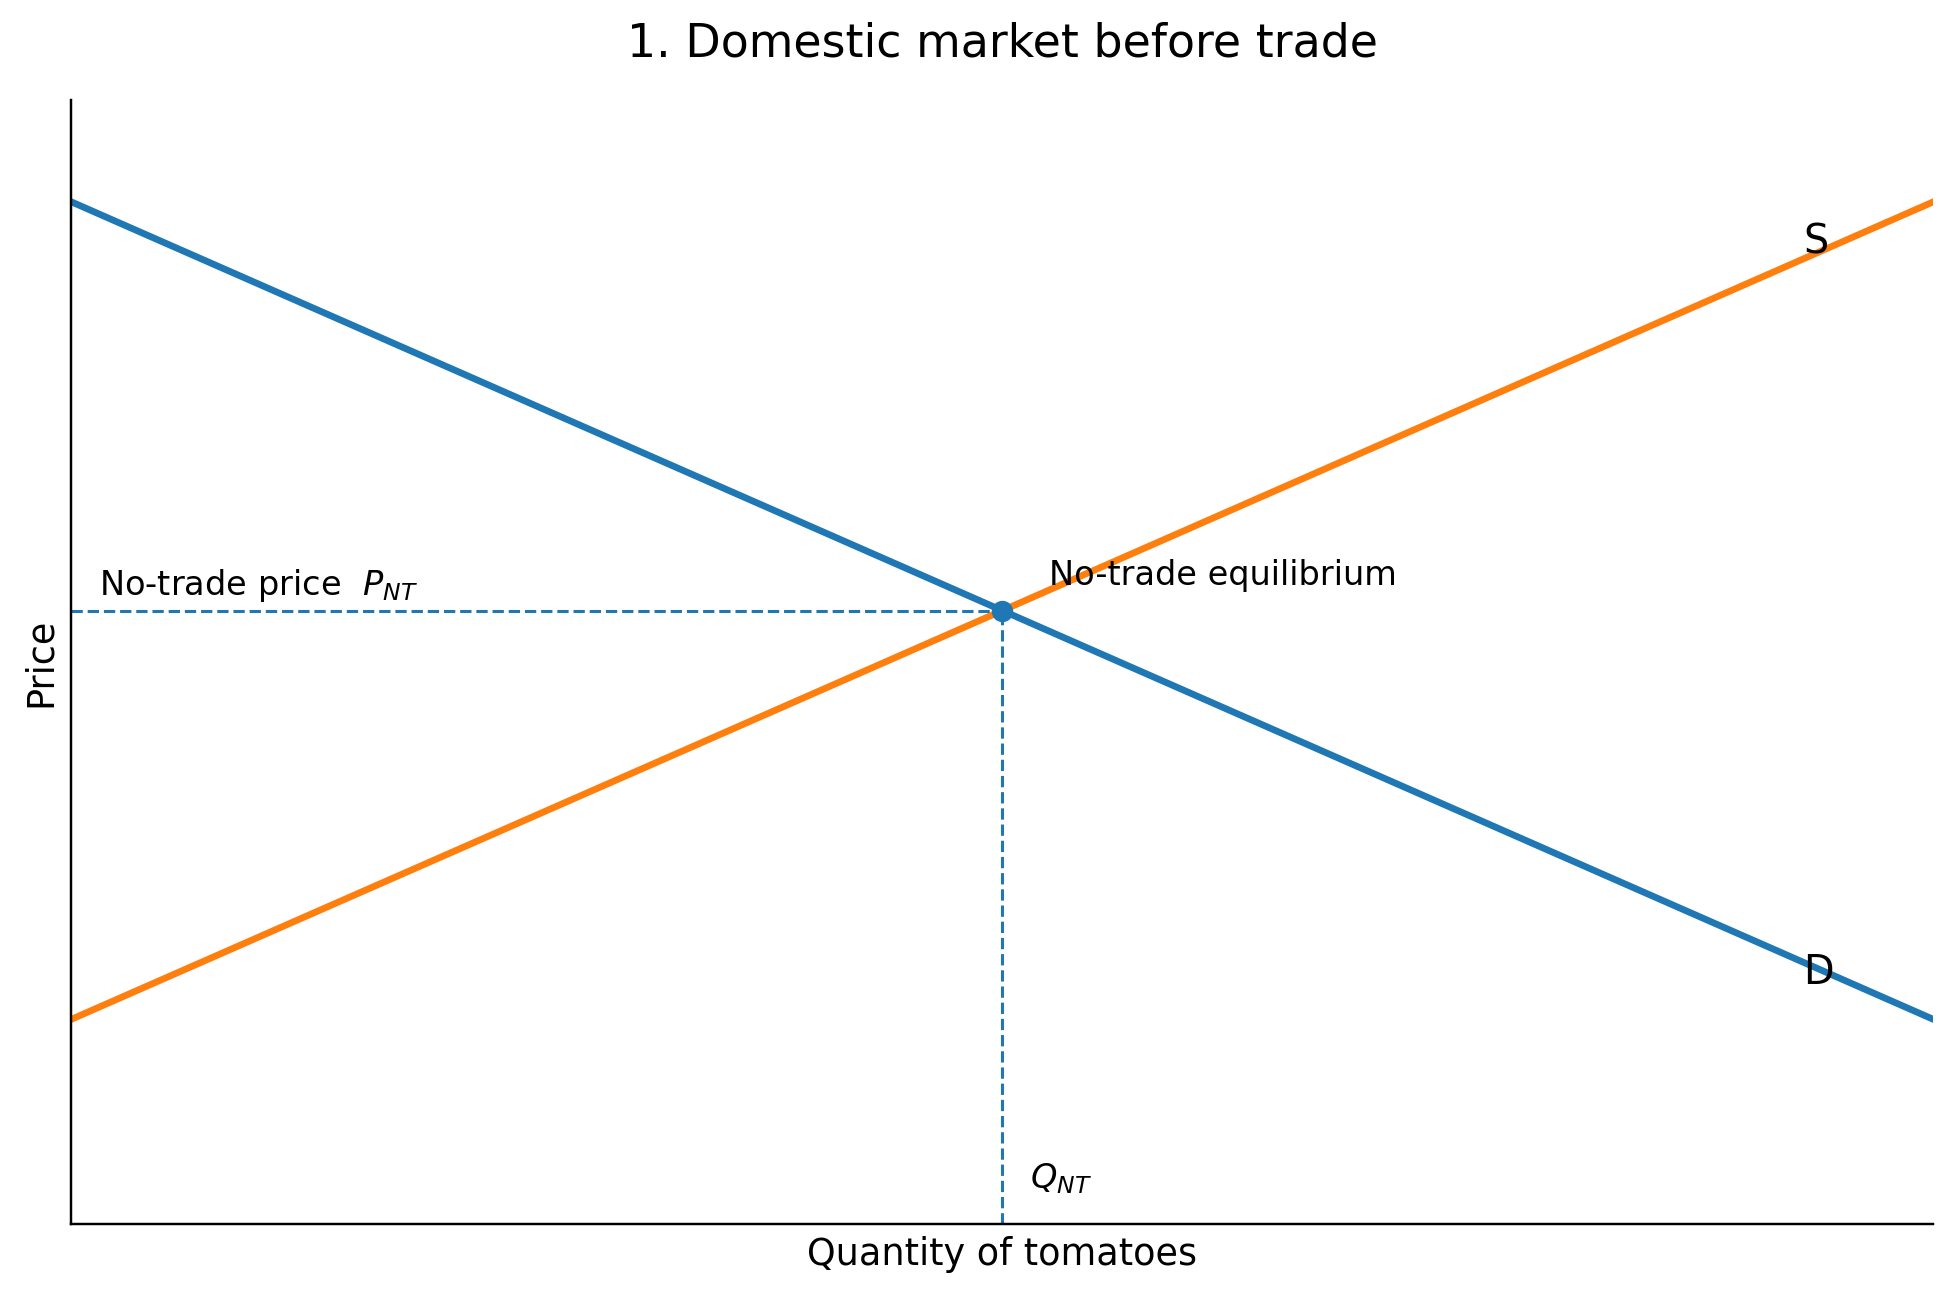
At this stage there are no imports. The whole market is being supplied by domestic producers.
Now allow supermarkets to buy from overseas
Suppose the trade restriction is removed and supermarkets are now free to buy tomatoes from foreign producers as well as British ones.
Joanne is an intermediary, not the final consumer. The demand curve in the diagram represents the people buying tomatoes from the supermarket, while Joanne’s job is to source the tomatoes needed to meet that demand.
That does not automatically mean the supermarket will import them.
The important question is:
At what price can they buy tomatoes from overseas?
This is where the idea of the world price enters the model.
What is the world price?
In reality, there is not one single price at which every tomato producer in the world sells.
Different producers charge different prices, and the price paid by an importer can depend on quality, transport costs, contracts, exchange rates and bargaining.
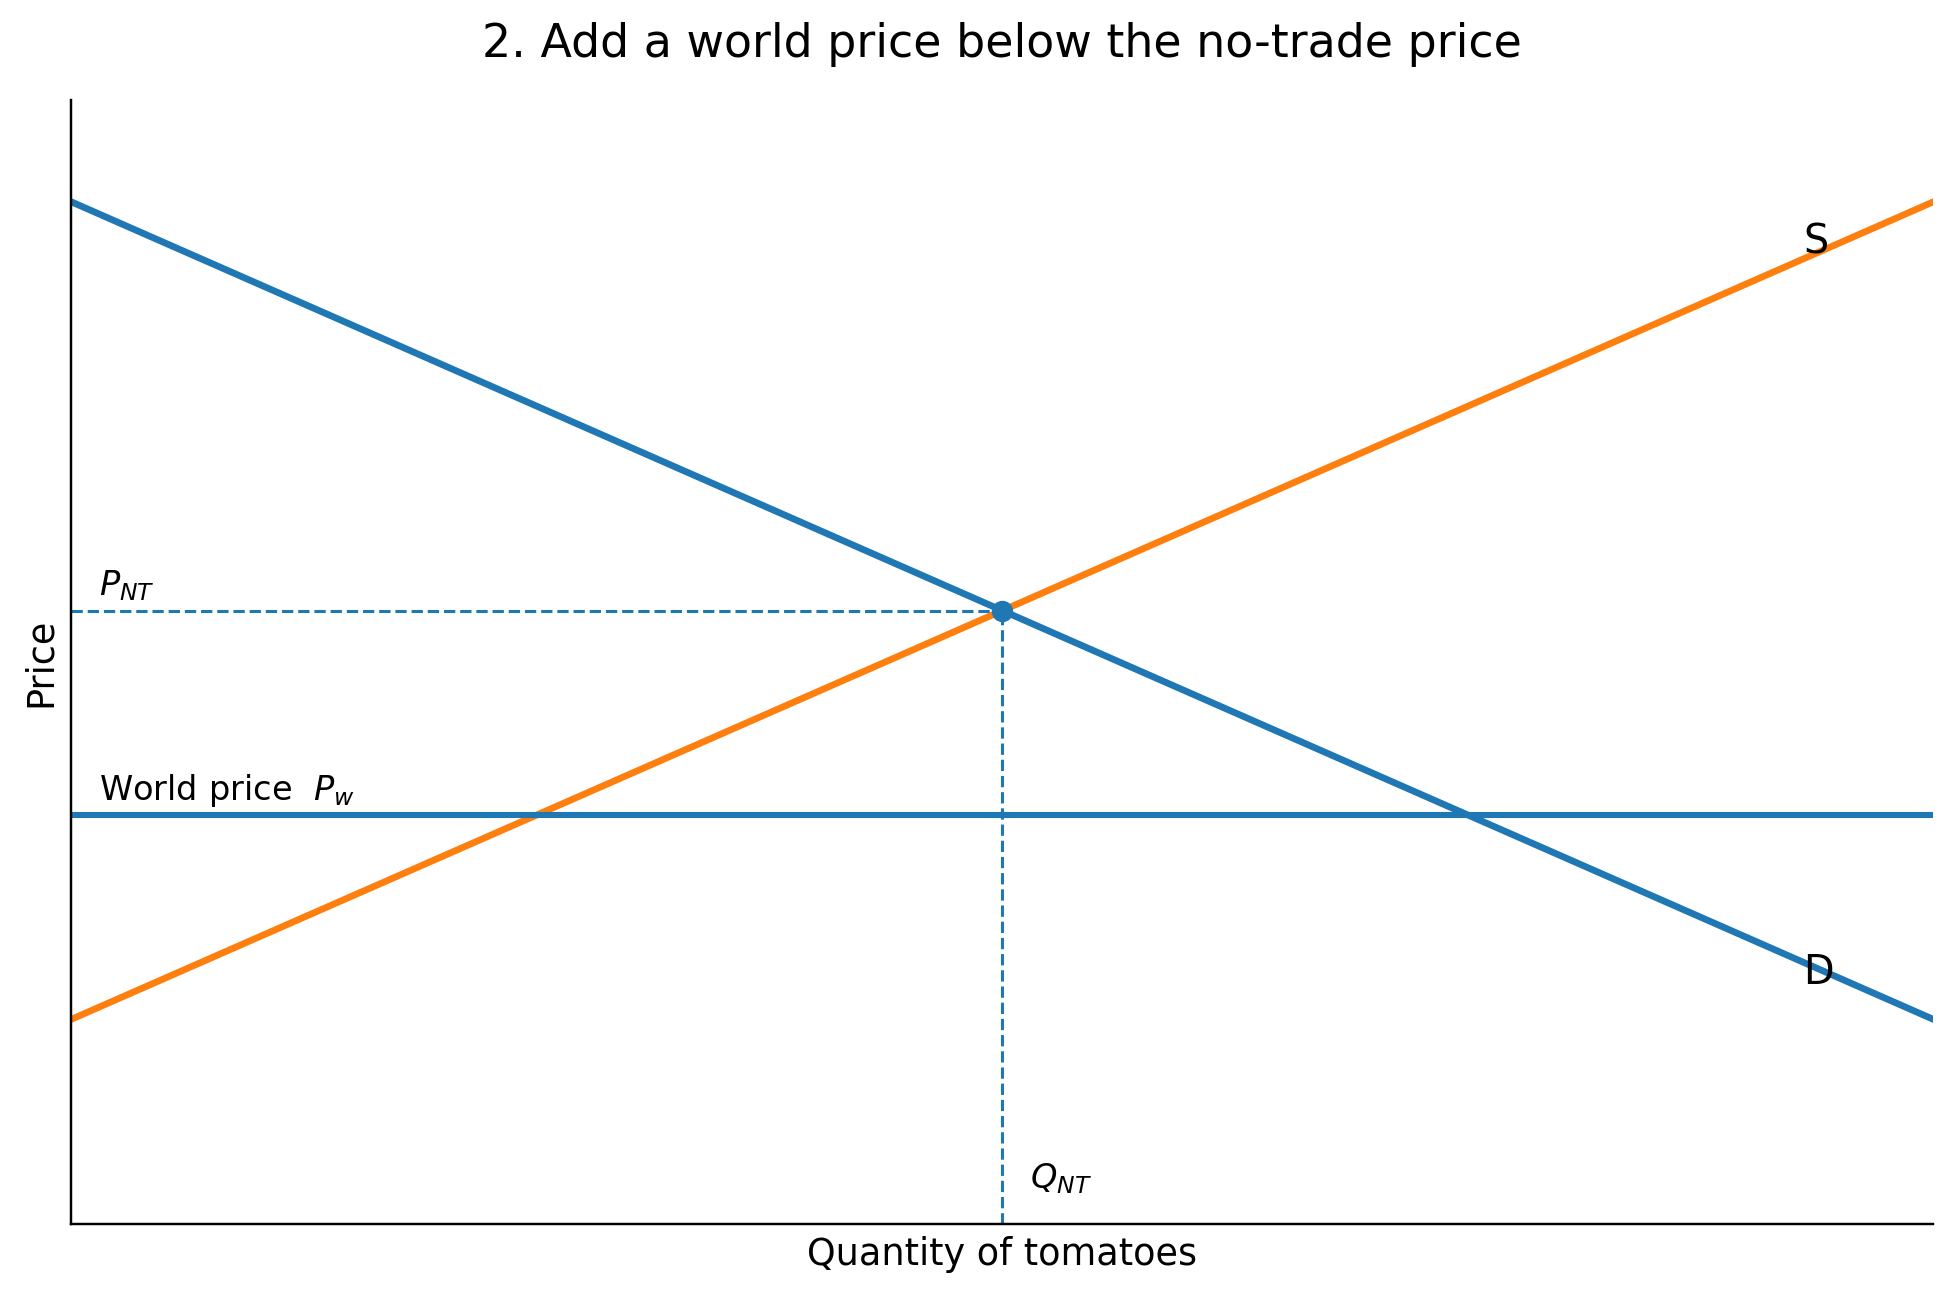
The standard model simplifies all of that into a single world price, usually labelled:
Pw
In this model, Pw is the price at which tomatoes can be bought in Britain from overseas.
Britain is assumed to be a price taker in the world market. In other words, British purchases are too small to change the world price.
Foreign suppliers are therefore treated as willing to supply Britain with as many tomatoes as it wants at Pw. Economists describe this as a perfectly elastic supply of imports.
That is why the world-price line is horizontal.
What is the model assuming?
The diagram relies on some simplifying assumptions.
We assume that imported and British tomatoes are close enough substitutes that buyers are willing to switch between them.
We also leave out transport costs and other trading costs, and assume there are no remaining barriers to imports.
Finally, we assume that Britain can buy as many tomatoes as it wants at Pw without changing the world price.
These assumptions are not meant to describe every detail of the real tomato market. They allow us to isolate the effect of trade.
Why does the domestic price fall towards the world price?
Suppose British tomato producers tried to continue charging the no-trade price even though supermarkets could now buy equivalent tomatoes more cheaply from overseas.
Buyers such as Joanne would have an obvious alternative: they could switch towards imports.
As supermarkets bought more from overseas, British producers would lose sales unless they reduced their own prices.
In the standard model, this competitive process pulls the domestic price down to Pw.
In reality, the domestic price might remain slightly above the international price because of transport costs, quality differences, contracts or retailer margins. But the model leaves those complications out.
The important point is that access to cheaper imports puts downward pressure on the domestic price.
What happens to consumers?
At the lower world price, consumers want to buy more tomatoes.
This is a movement along the demand curve.
Demand itself has not shifted. Instead, the lower price causes the quantity demanded to rise.
At Pw, consumers buy more than they did at the no-trade price.
What happens to domestic producers?
British producers now face the lower world price.
At that price, they are willing to supply fewer tomatoes.
Again, this is a movement along the supply curve, not a shift in supply.
Some British production that was profitable at the no-trade price is no longer profitable at Pw, so domestic producers supply less.
That creates a gap between what British consumers want to buy and what British producers are willing to supply.
Where do imports appear on the diagram?
At Pw, suppose final consumers want to buy 100 units, while British producers supply only 40.
The remaining 60 units are imports.
Supermarkets such as Joanne’s source those 60 units from overseas. Because the model assumes foreign suppliers are willing to supply as much as Britain wants at Pw, there is no shortage.
So:
Imports = domestic quantity demanded − domestic quantity supplied at the world price
On the graph, imports are simply the horizontal gap between domestic supply and domestic demand at Pw.
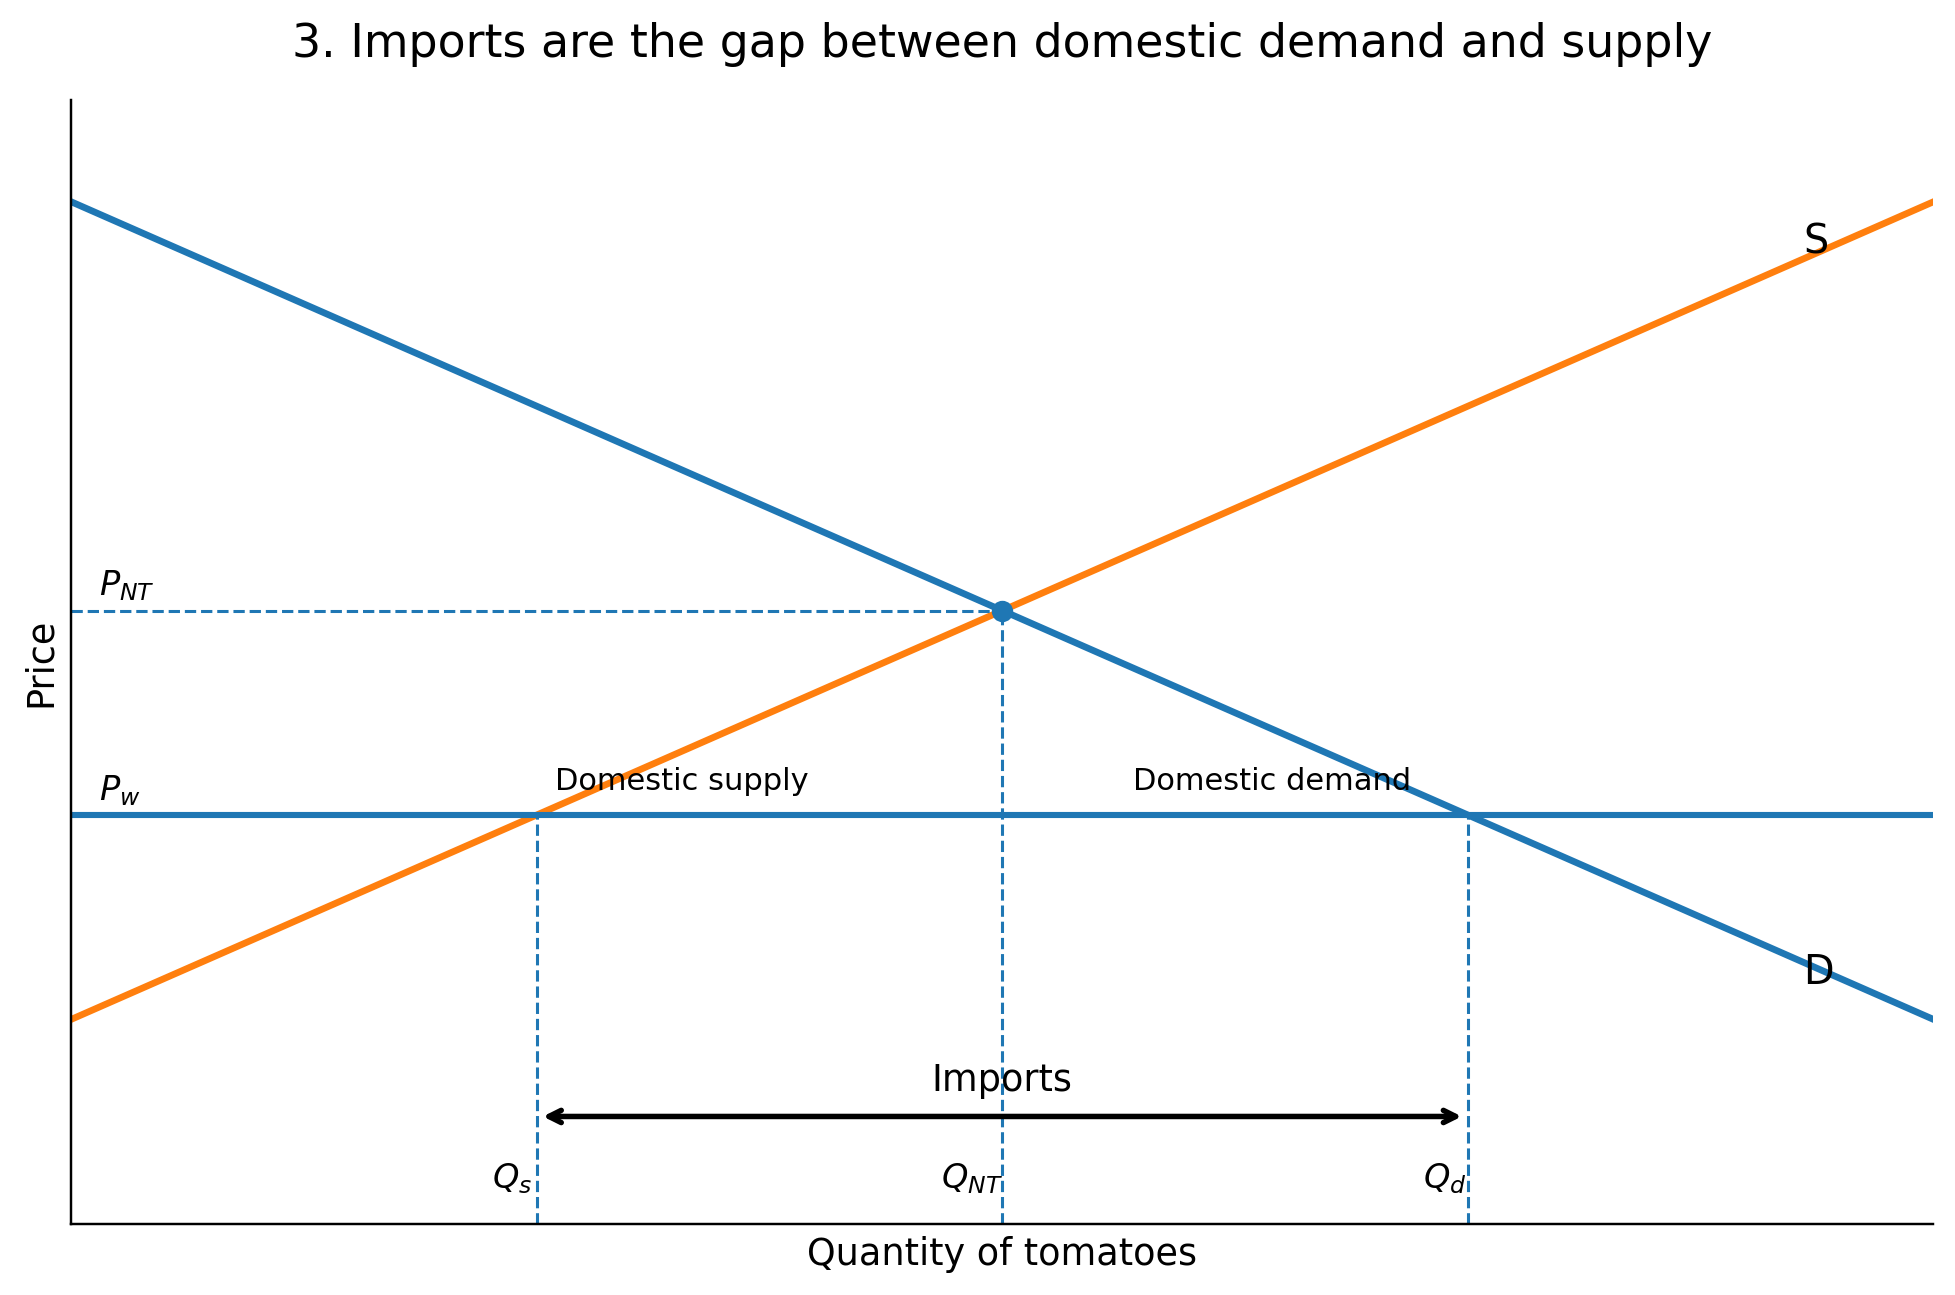
This is worth noticing because there is no separate “imports curve” in the standard diagram.
Imports are the amount needed to fill the difference between what domestic consumers want to buy and what domestic producers want to supply at Pw.
Why might the world price be lower?
In this example, imports appear because Pw is below the no-trade price.
Foreign producers may face lower costs, enjoy more favourable production conditions or operate on a larger scale.
But in the real world, imports do not have to be cheaper.
Buyers may choose an imported product because of its quality, variety, branding or availability.
The model leaves those differences out so that we can isolate the effect of price.
So in our simplified model, if imported tomatoes are available at a lower price than the no-trade price, supermarket buyers such as Joanne have an incentive to source them from overseas.
If the world price were above the domestic price instead, the country would tend to export rather than import. We are ignoring exports here because we are building towards the tariff case.
What is the model simplifying?
In the real supermarket business, there may be many different prices at different stages.
Joanne negotiates with suppliers. There are transport and storage costs. Exchange rates move. Contracts may already be in place. The supermarket adds its own costs and margin before the tomatoes reach the customer.
The standard trade diagram leaves those intermediate stages out.
The demand curve represents the final consumers buying tomatoes. Supermarkets such as Joanne’s are intermediaries helping to meet that demand.
The diagram therefore does not separately show the supermarket’s buying price, costs, margin and retail price.
Joanne’s negotiated purchase price might be close to the international price used in the model, but it is not literally Pw.
The model sacrifices some realism in order to make the main mechanism easier to see.
The key idea
The world-price model shows why imports arise when a product can be bought more cheaply overseas.
At Pw, domestic consumers want to buy more than domestic producers want to supply.
The difference is filled by imports.
That gives us the free-trade position we need before we introduce a tariff.
In the next article, How Does a Tariff Work? The Tariff Diagram Explained we change just one thing: add a tariff to imports, and see what happens to the domestic price, domestic production, consumption and the quantity imported.
Continue the Tariffs Learning Pathway
← Part 1 — Who Actually Pays a Tariff?
Part 3 → How Does a Tariff Work? The Tariff Diagram Explained