Microeconomics → Government Intervention → Subsidies | Part 2 of 7
Part 2 of our seven-part subsidy learning pathway. Build the subsidy diagram step by step, using Luke's dairy farm to understand how prices and quantities change.
In our previous article, How Does a Subsidy Actually Work?, we met Luke, a dairy farmer who sells milk to a processor for 40p per litre.
We saw how a government subsidy of 5p per litre could encourage Luke and other farmers to produce more milk, and why the price paid by processors might fall.
Now we're going to show the same process using a supply and demand diagram. Rather than starting with a completed diagram, we'll build it step by step so you can see what each part means.
Why do economists use diagrams?
Luke's dairy farm is part of a complicated market. Farmers have different costs, processors have different requirements, and prices are influenced by many things.
So how can we work out what difference a subsidy might make?
Economists simplify the real world into models. A supply and demand diagram is one such model. It concentrates on a few important relationships — in this case, prices, quantities and how farmers and processors respond to them.
Think of a London Underground map. It leaves out most of London's streets and buildings so we can understand how the stations connect. An economic diagram does something similar: it leaves out details so we can concentrate on the relationships we're trying to understand.
The diagram won't tell us exactly what will happen to milk prices. But it can help us understand why prices and quantities might change, and what determines the outcome.
Let's build it step by step.
1. Start with the market before the subsidy
Before the subsidy is introduced, the market for milk is in equilibrium. At 40p per litre, the amount farmers want to sell matches the amount processors want to buy.
We can represent this using two curves. The demand curve (D) slopes downwards because processors are generally willing to buy more milk when its price is lower. The supply curve (S₁) slopes upwards because farmers are generally willing to produce more milk when they can sell it for a higher price.
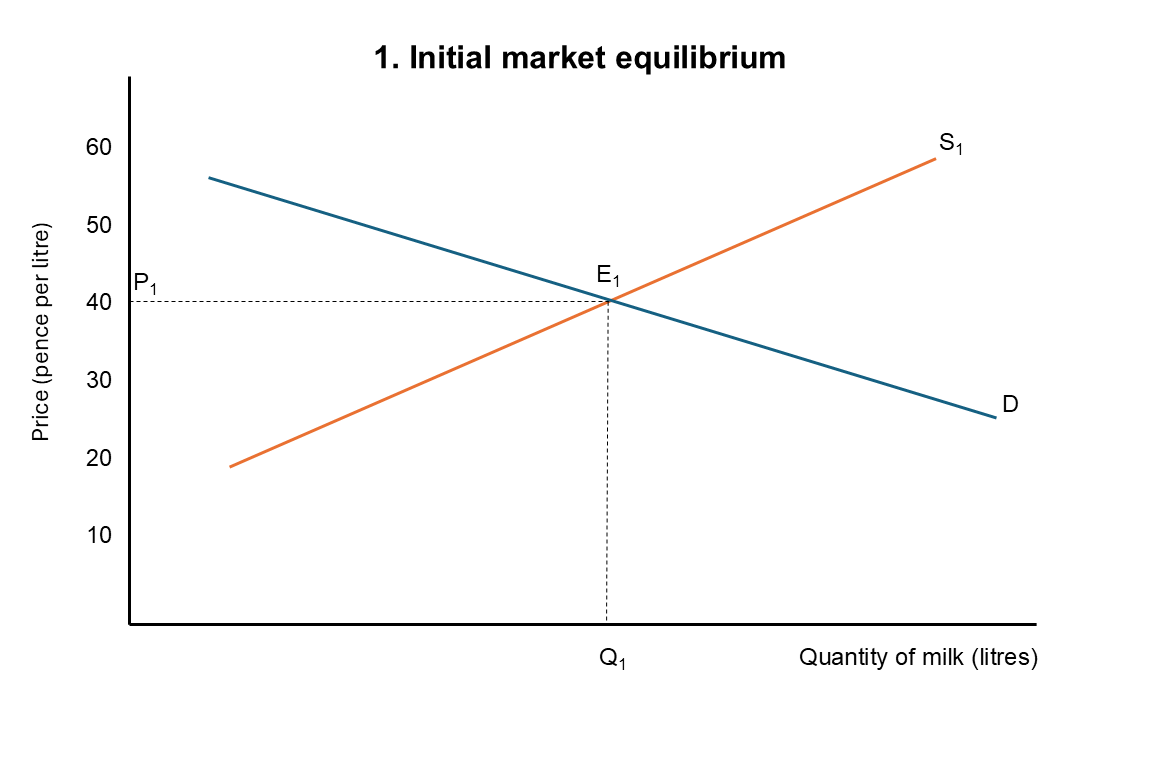
The point where the curves cross is called the market equilibrium. At this point, the quantity demanded equals the quantity supplied, so there is no persistent shortage or surplus of milk.
In Luke's example, the equilibrium price is 40p per litre. We label this P₁ on the vertical axis and the corresponding quantity Q₁ on the horizontal axis.
This is our starting point. Farmers receive 40p per litre, processors pay 40p, and the market is in equilibrium.
2. How does the subsidy change the supply curve?
The government now introduces a subsidy of 5p for every litre of milk sold.
Before the subsidy, if a processor paid Luke 40p per litre, that was all he received. Now, if the processor continues paying 40p, Luke receives 45p altogether: 40p from the processor and 5p from the government.
This makes producing additional milk more attractive. But there's another way to look at the same change.
Suppose that before the subsidy Luke needed to receive 40p per litre to make supplying a particular quantity of milk worthwhile. With the subsidy, he would need only 35p from the processor, because the government would pay the remaining 5p.
His actual production costs haven't fallen. The subsidy simply means he can receive the same total amount even when the processor pays him less.
And this applies at other prices too. If farmers previously needed 45p from processors to supply a particular quantity, they now need only 40p. If they previously needed 50p, they now need only 45p.
We can show this on our diagram by drawing a new supply curve, S₂, exactly 5p below S₁ at every quantity.
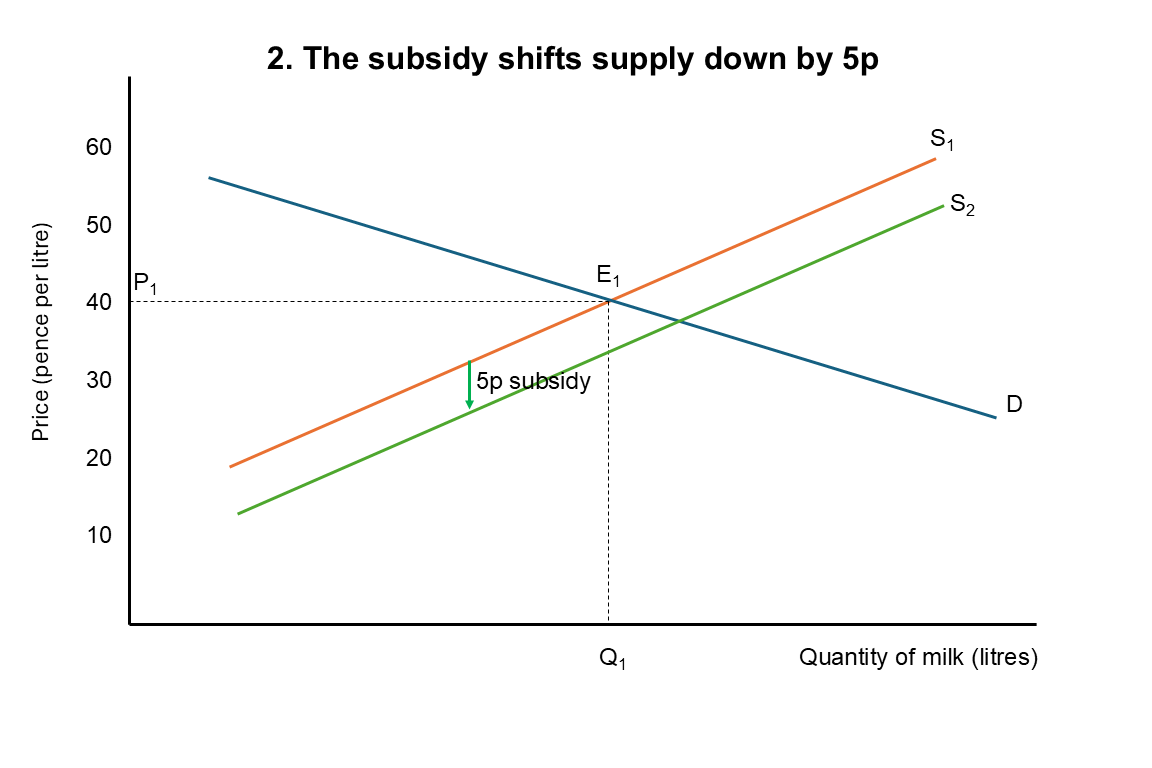
This is called a downward shift of the supply curve. It is also described as a shift to the right, because at any given price paid by processors, farmers are willing to supply more milk than before. Both describe the same change.
The important point is that the subsidy hasn't made milk cheaper to produce. It has reduced the price farmers need to receive from processors to make supplying milk worthwhile.
3. What happens at the original price?
Before the subsidy, the market was in equilibrium at 40p per litre. But farmers are now willing to supply more milk at that price because they also receive 5p from the government.
Processors, however, have no reason to buy more milk at 40p than they did before. Their demand hasn't changed.
So, at the original price, farmers now want to sell more milk than processors want to buy. Economists call this a surplus, or excess supply.
Farmers who want to sell their additional milk may be willing to accept a lower price from processors. As the price falls, processors are willing to buy more milk, while farmers are willing to supply less than they would have at 40p.
This continues until the amount farmers want to sell once again equals the amount processors want to buy. The market has reached a new equilibrium.
4. Where is the new equilibrium?
Look at where the demand curve crosses the new supply curve, S₂. This is the new equilibrium, which we'll label E₂.
At this point, the amount farmers want to sell once again equals the amount processors want to buy.
To find the new equilibrium price, draw a horizontal line from E₂ to the vertical axis. We'll call this P₂. It is the price processors now pay for milk.
To find the new equilibrium quantity, draw a vertical line from E₂ to the horizontal axis. We'll call this Q₂.
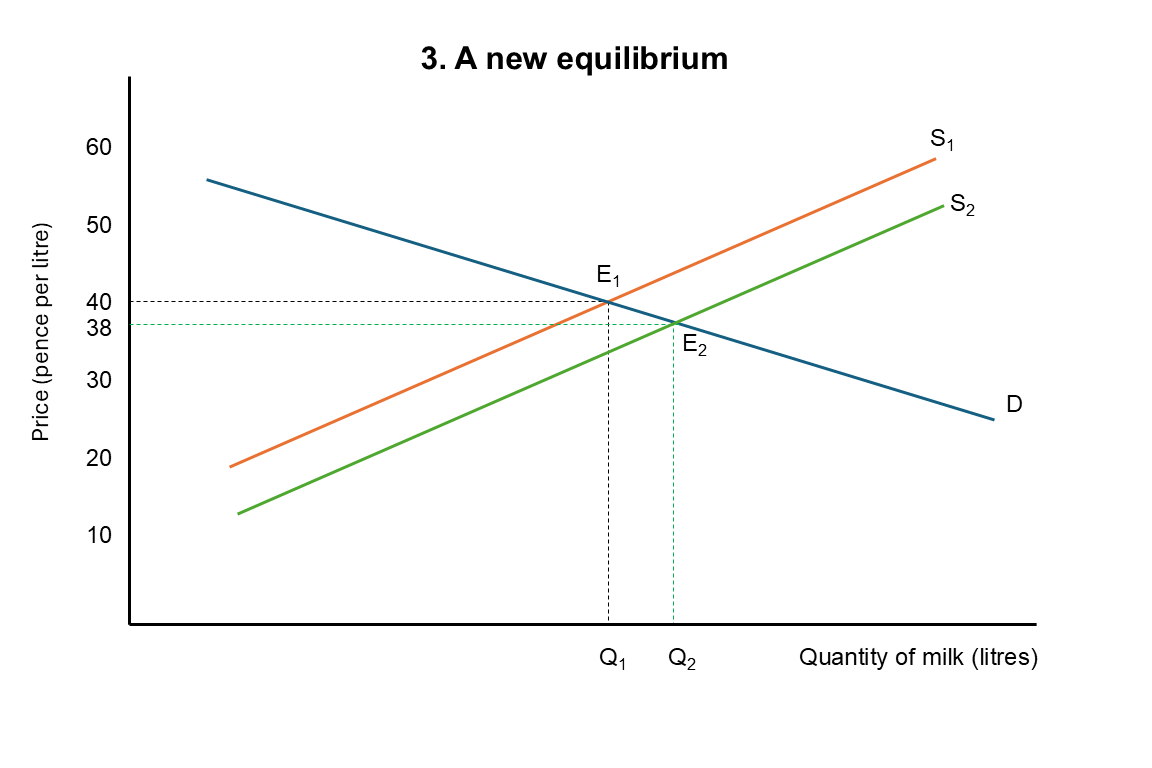
Notice what has happened. The price paid by processors has fallen from P₁ to P₂, while the quantity of milk bought and sold has increased from Q₁ to Q₂.
In Luke's example, we imagined that the price paid by processors fell from 40p to 38p per litre. The actual size of the price change would depend on how farmers and processors respond to the subsidy.
So the diagram now shows two effects: a lower price paid by processors and a greater quantity of milk bought and sold.
But there's something missing. We haven't yet shown the 5p that the government pays farmers. That means P₂ isn't the total amount farmers receive.
5. How much do farmers actually receive?
We've established that the new equilibrium price paid by processors is P₂. In our example, that's 38p per litre.
But the government is also paying farmers 5p for every litre sold. So although processors pay 38p, farmers receive 43p altogether.
We need to show this on the diagram.
Start at the new equilibrium quantity, Q₂, and move vertically upwards until you reach the original supply curve, S₁. Then draw a horizontal line across to the price axis. We'll call this price P₃.
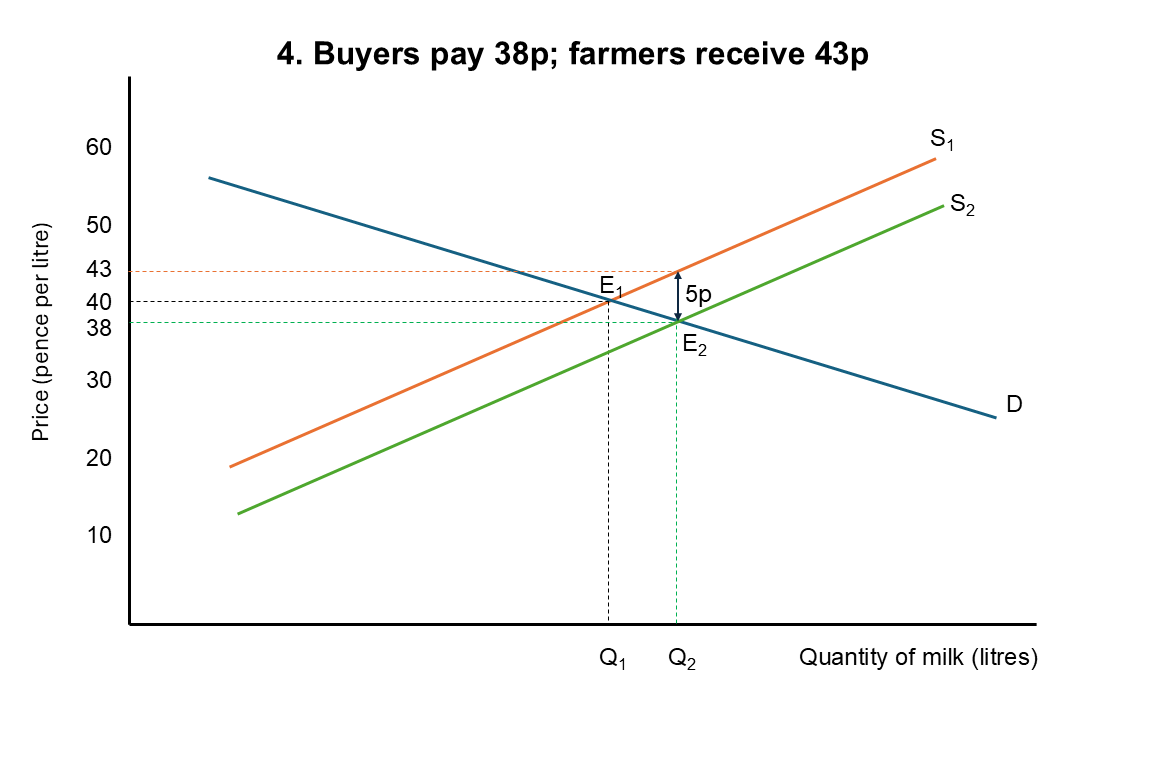
Why do we use the original supply curve? Before the subsidy, S₁ showed how much farmers needed to receive to make supplying different quantities of milk worthwhile. Economists call this the marginal cost of supply: the cost of producing one additional unit.
At Q₂, the original supply curve shows the amount farmers need to receive for the last litre produced. Their production costs haven't changed, so we still use S₁ to find that amount.
In our example, farmers therefore need to receive 43p per litre altogether. The processor pays 38p, and the government provides the remaining 5p.
So the diagram now shows two prices:
P₂ = 38p: the price paid by processors.
P₃ = 43p: the total amount received by farmers, including the subsidy.
The vertical distance between P₂ and P₃ is exactly 5p, the amount of the subsidy.
Before the subsidy, farmers received 40p per litre. Afterwards, they receive 43p, while processors pay 38p instead of 40p.
Both sides of the market therefore benefit in this example, although the government pays the full 5p.
6. How much does the subsidy cost the government?
The government pays farmers 5p for every litre of milk sold after the subsidy is introduced. Importantly, it pays the subsidy on all the milk sold, not just the additional milk produced because of the subsidy.
We can calculate total government expenditure using:
Government expenditure = Subsidy per litre × Quantity sold after the subsidy
On our diagram, this is represented by a rectangle. Its height is the difference between P₂ and P₃, which is 5p per litre. Its width is Q₂, the new equilibrium quantity of milk sold.
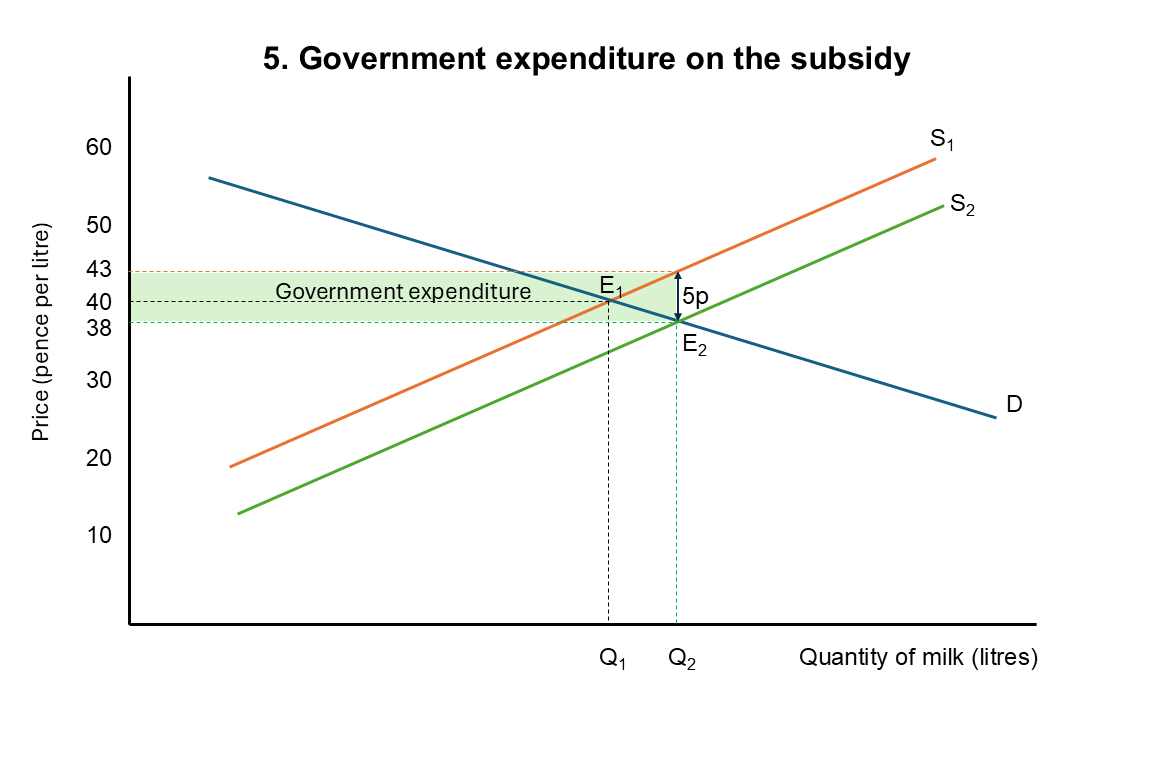
The area of the rectangle therefore represents the government's total expenditure on the subsidy.
Notice that the rectangle extends all the way from zero to Q₂, not just from Q₁ to Q₂. This is because the government pays the subsidy on the milk farmers would have sold anyway, as well as the additional milk.
The diagram now shows the main effects of the subsidy: the price paid by processors falls, the amount received by farmers rises, the quantity of milk sold increases, and the government incurs expenditure.
How accurate is our diagram?
Our diagram shows the price paid by processors falling from 40p to 38p, while farmers receive 43p including the subsidy.
But how do we know the supply and demand curves have those particular slopes?
We don't.
We've drawn them to illustrate how a subsidy works. We haven't measured the actual supply and demand curves for milk.
To predict what would really happen, economists would need evidence about how farmers respond to changes in the prices they receive, and how processors respond to changes in the prices they pay.
The diagram helps us understand the economic mechanism. But without that evidence, we cannot know exactly how much prices or quantities would change.
That's an important distinction between understanding how an economic model works and knowing how accurately it describes the real world.
Putting it all together
We've built the subsidy diagram one step at a time, starting with the original market equilibrium and then showing how the subsidy changes farmers' incentives.
The downward shift in supply reflects the fact that farmers can now accept a lower price from processors while receiving the same total amount. The new equilibrium shows how the price and quantity adjust, while the gap between P₂ and P₃ represents the subsidy.
Once you understand those relationships, the diagram becomes much easier to draw and explain.
In the next article, Who Benefits from a Subsidy?, we'll look more closely at why the benefit of a subsidy is divided between buyers and sellers, and what determines how much each receives.
Continue the Subsidies Learning Pathway
← Part 1 — How Does a Subsidy Actually Work?
Part 3 → Who Benefits from a Subsidy?